Overview
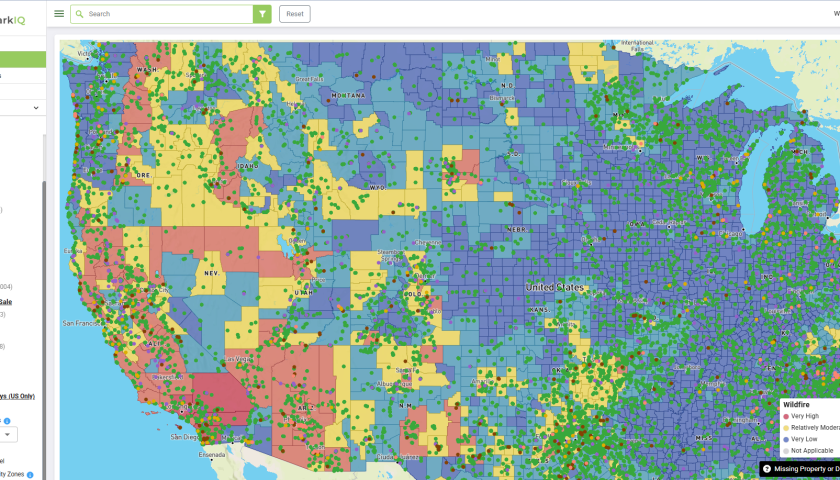
Camping is booming, and the RV Parks and Campgrounds market is riding the wave. Fueled by post-pandemic lifestyle shifts and the rise of remote work, Americans increasingly embrace outdoor recreation as an affordable and flexible alternative to traditional travel, allowing them to work, explore, and reconnect with nature. Younger and more diverse demographics are driving participation while evolving consumer preferences are reshaping the market. According to RVParkIQ, the U.S. hosts 12,055 RV parks with 1,181,210 camping spots, averaging 20.93 acres per park.

Despite this, supply has struggled to keep pace with demand, creating significant opportunities. According to KOA’s 2024 Camping & Outdoor Hospitality Report, there has been a 98% increase in the number of households who camp three or more times annually over the past decade, reflecting a sustained interest in outdoor recreation. With a Demand-Supply Ratio of 42.5 campers per camping spot, constrained availability drives pricing upward. In fact, nearly 15% of U.S. households are participating in camping, representing a potential base of 48.8 million campers – a clear signal for operators to expand infrastructure and capitalize on unmet demand.
This report offers a high-level overview of the RV parks and campgrounds industry, focusing on six key markets – California, New York, Texas, Colorado, Utah, and Idaho – based on a market analysis conducted by CRR Hospitality. The analysis examines a 250-mile radius around each region, which, in cases like New York, may extend into neighboring states. On average, RV travelers and campers often seek destinations within a 3-5 hour drive (approximately 250 miles), making this range a realistic travel distance for weekend trips or short-term stays and a meaningful measure of market dynamics.
Key Markets
The three largest markets – California, New York, and Texas – lead the industry with strong demand, premium pricing, and established infrastructure. In contrast, the fastest growing markets – Colorado, Utah, and Idaho – present significant investment potential, driven by favorable participation rates, low market saturation, and competitive pricing. This report highlights both the challenges and opportunities for operators to meet rising demand and adapt to evolving consumer preferences.
California*
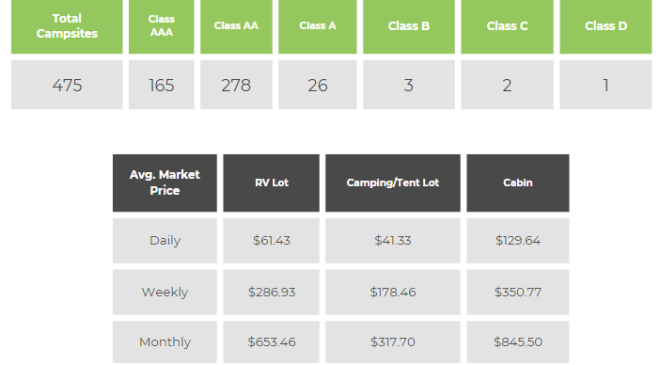
California’s RV parks and campgrounds market boasts vast potential, with 3.05 million campers and strong demand solidifying its position as an industry leader. However, a high campers-to-spots ratio of 52.08 highlights constrained supply, driving premium pricing. The state hosts 479 RV parks with 77,315 camping spots, and the average nightly rate of $61.44 significantly exceeds the national average of $52.15, reflecting California’s mature market and appeal to families and high-income travelers. Driven by Class AA campsites and its status as a top tourist destination, the market thrives but faces challenges from saturation in key regions, creating barriers for new entrants.
New York*
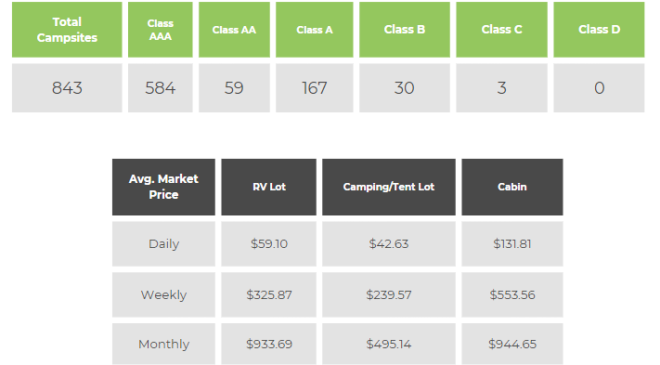
The New York area stands out as a leader in the RV parks and campgrounds market, driven by 5.39 million campers and a high campers-to-spots ratio of 63. The region encompasses 933 RV parks and 140,673 camping spots, with nearly 70% of sites rated Class AAA, reflecting the prevalence of premium facilities. This concentration of high-quality offerings, combined with limited supply, drives the average nightly rate to $59.11 – well above the national average of $52.15. While strong demand supports elevated pricing, a high density of RV parks, particularly those with Class AAA ratings, and the region’s highly seasonal market due to cold winters, presents challenges for future growth and expansion.
Texas
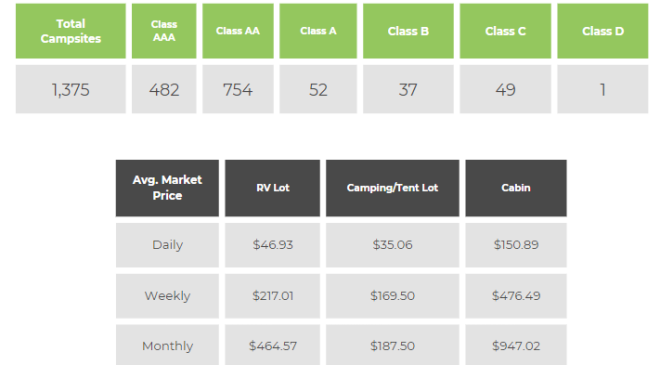
Texas hosts 1,405 RV parks and 76,352 camping spots, offering a more balanced market with 1.23 million potential campers and a campers-to-spots ratio of 42.64, closely aligning with the national average. The state’s average nightly rate of $46.93 is notably lower than the national average of $52.15, reflecting its affordability and appeal to cost-conscious families and long-term visitors. Over 50% of Texas campsites are Class AA rated, while 35% are premium Class AAA rated, offering elevated amenities for more discerning travelers. Texas’ combination of affordability, scale, and diverse offerings supports consistent performance and positions it as a key market for broad consumer appeal.
Colorado
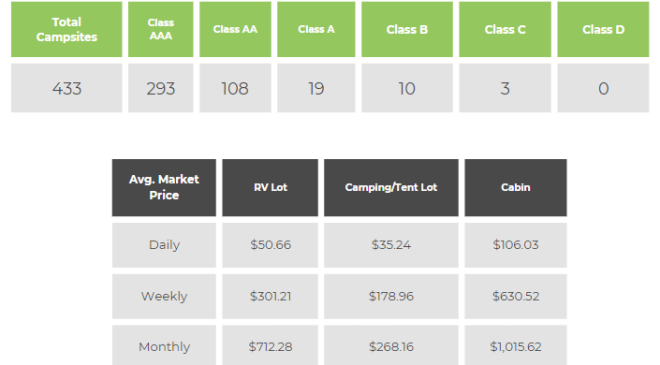
Colorado’s reputation for outdoor recreation drives steady growth, with 445 RV parks and 25,560 camping spots within a 250-mile radius. The market boasts a 14.64% participation rate and a campers-to-spots ratio of 36.85, suggests that the market is less saturated, thus, new developments or expansions are less likely to face immediate competition. Seasonal tourism and strong demand for adventure-driven camping experiences fuel consistent growth. Notably, 68% of campsites are Class AAA rated, providing a balance of quality and affordability, reflected in the $50.66 average nightly rate for an RV lot. This combination positions Colorado as a prime market for operators seeking to capitalize on its well-established reputation as a premier outdoor recreation destination.
Utah
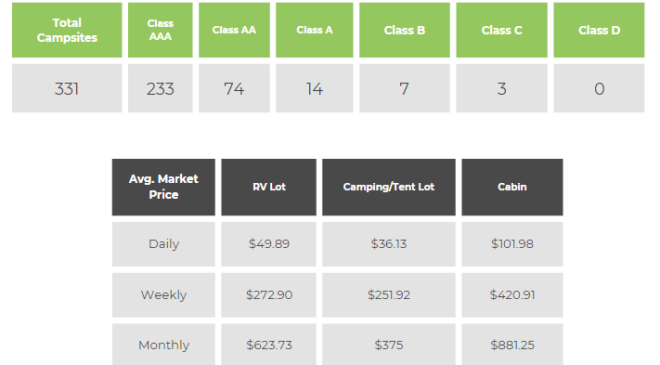
Utah’s market features 336 RV parks and 21,021 camping spots, with a campers-to-spots ratio of 27.18, well below the national average, highlighting significant growth potential. The state’s average nightly rate of $48.89 for an RV lot is notably lower than the national average of $52.15, enhancing its appeal to budget-conscious travelers. Over 70% of campsites are Class AAA rated, offering high-quality facilities that attract recreation-focused visitors. Combined with competitive pricing, low market saturation, and steady influx of adventure-seekers, Utah stands out as a strong growth market for future RV park expansion and development.
Idaho
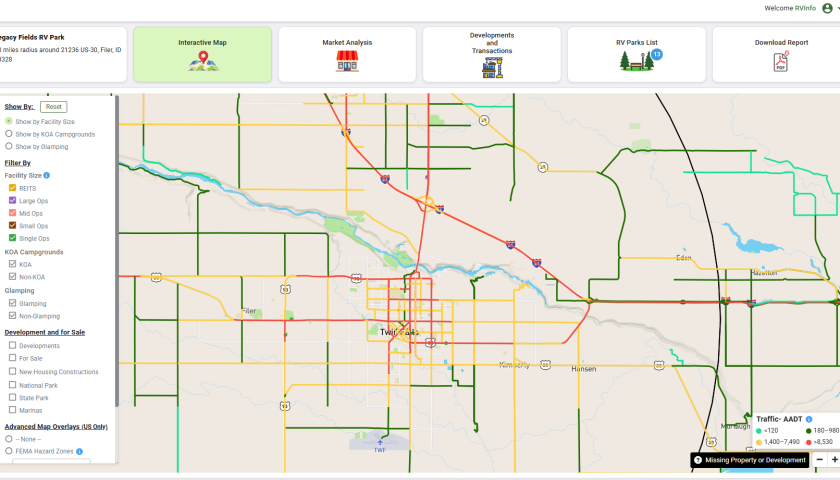
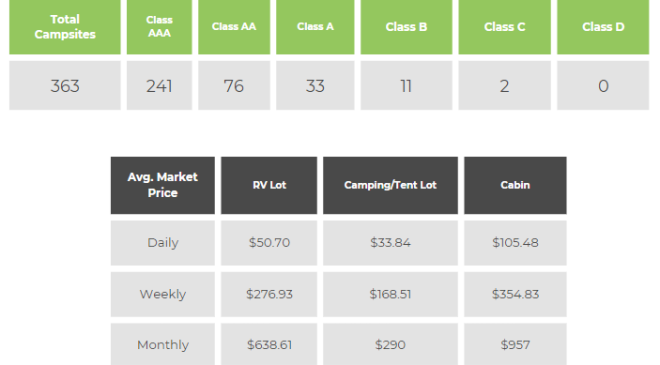
Idaho’s market comprises 376 RV parks and 18,567 camping spots, serving 159,883 potential campers. With a campers-to-spots ratio of 21.04 – the lowest among the six markets analyzed – Idaho offers substantial capacity for future growth. The state’s average nightly rate of $50.70 is slightly below the national average of $52.15, adding to its affordability. Nearly 70% of campsites are Class AAA rated, providing high-quality facilities that cater to modern travelers and elevate the market’s appeal. Coupled with pristine outdoor spaces, low market saturation, and competitive pricing, Idaho presents a compelling opportunity for investment and new development.
Key Findings
The RV parks and campgrounds industry has seen robust growth over the past decade, driven by shifting consumer preferences and a rising desire for unique, nature-based experiences. According to KOA’s report, 39 million new campers have entered the market since 2014, reflecting the industry’s sustained momentum. This growth has been fueled by younger and more diverse demographics, with glamping and RV camping emerging as high-demand segments. Post-pandemic remote work flexibility has further supported this trend, allowing consumers to combine travel and work seamlessly. However, challenges such as development costs, environmental and regulatory hurdles, and economic uncertainties impacting discretionary spending persist.
Technology and enhanced amenities are transforming the industry to meet evolving expectations. Online booking platforms, Wi-Fi access, and digital check-ins improve convenience, while luxury camping options appeal to travelers seeking comfort. Sustainability also remains a growing priority, with many campgrounds adopting eco-friendly practices like solar panels and low-impact infrastructure.

Conclusion
Despite challenges like rising costs and constrained supply, the RV parks and campgrounds market continues to thrive. Established markets such as California and New York lead with premium pricing and strong infrastructure, while high-growth regions like Colorado, Utah, and Idaho offer significant investment opportunities. With a nationwide participation rate of 14.82% and demand from 48.8 million campers, the sector is well-positioned for sustained growth. Operators who innovate through pricing strategies, infrastructure expansion, and modernized amenities are best placed to capitalize on this dynamic and expanding sector.
Definitions
Camping Spot Classifications
- AAA is A + AA + Additional Features
- AA is A + Full Hook up
- A is partial hook up + Additional features like a picnic table
- B is Partial Electric and Partial Water
- C is No Hookups
- D is Tent camping (No vehicular access)
Campers-to-Spots Ratio (Demand Supply Ratio): Number of campers per camping spot.
About RVParkIQ
RVParkIQ is a premier market analysis platform for the RV park and campground industry, currently tracking over 12,000 RV parks and campgrounds nationwide. Designed for investors, developers, and operators, RVParkIQ delivers actionable insights on market demand, supply, facility profiles, amenities, and more. With powerful tools for data-driven decision-making, RVParkIQ offers users tools to navigate the growing outdoor hospitality market with confidence. Learn more at RVParkIQ.com.

For Additional Data
Contact Us
info@rvparkiq.com | www.RVParkIQ.com | 1-800-377-3098


